Articles for author: Anshuman Singh

Anshuman Singh

nosql database

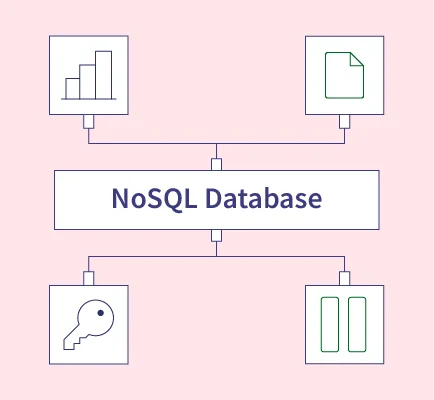
What is NoSQL? Guide to NoSQL Databases

The rise of NoSQL databases marked a pivotal shift in how modern applications store, manage, and retrieve data. Unlike traditional relational databases (RDBMS) that rely heavily on structured schemas and SQL queries, NoSQL systems offer greater flexibility, scalability, and speed. They emerged to meet the evolving needs of applications handling big data, real-time analytics, IoT, ...

Anshuman Singh

yarn architecture

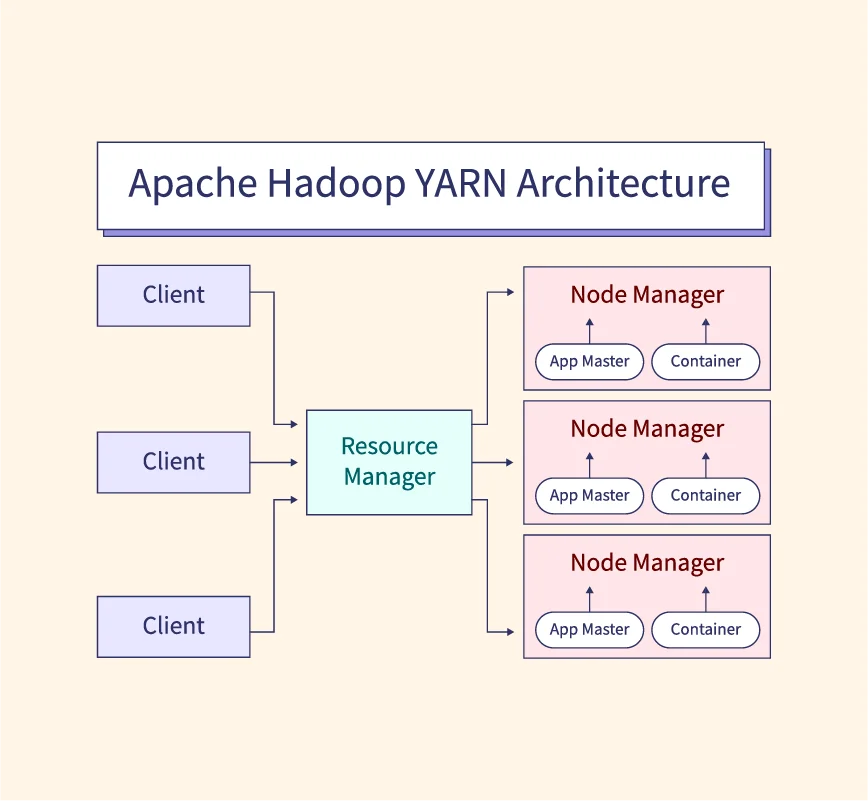
Hadoop YARN Architecture

As data science and big data applications grew in complexity and scale, efficient resource management became a critical need within the Hadoop ecosystem. Traditional MapReduce had limitations in handling diverse workloads and dynamic resource allocation, prompting the development of a more flexible solution—YARN (Yet Another Resource Negotiator). Introduced in Hadoop 2.0, YARN acts as the ...

Anshuman Singh

business intelligence tools

15 Business Intelligence Tools You Should Know in 2025

Business Intelligence (BI) tools are software applications that collect, process, and visualize data to support smarter, data-driven decision-making. These tools help organizations uncover trends, monitor performance, and forecast outcomes with precision. In 2025, BI tools remain essential for translating complex data into actionable business insights across industries and team sizes. Why Use Business Intelligence Tools? ...

ai in retail

Artificial Intelligence (AI) in Retail: Use Cases & Future Trends

Artificial Intelligence (AI) is reshaping the retail industry by driving smarter operations, hyper-personalized experiences, and data-informed decision-making. In an era where customer expectations are rapidly evolving, retailers face intense competition and growing pressure to deliver seamless, personalized, and responsive shopping journeys—both online and in-store. Shoppers today demand real-time service, tailored recommendations, and frictionless checkout. To ...

maximum likelihood estimation in machine learning

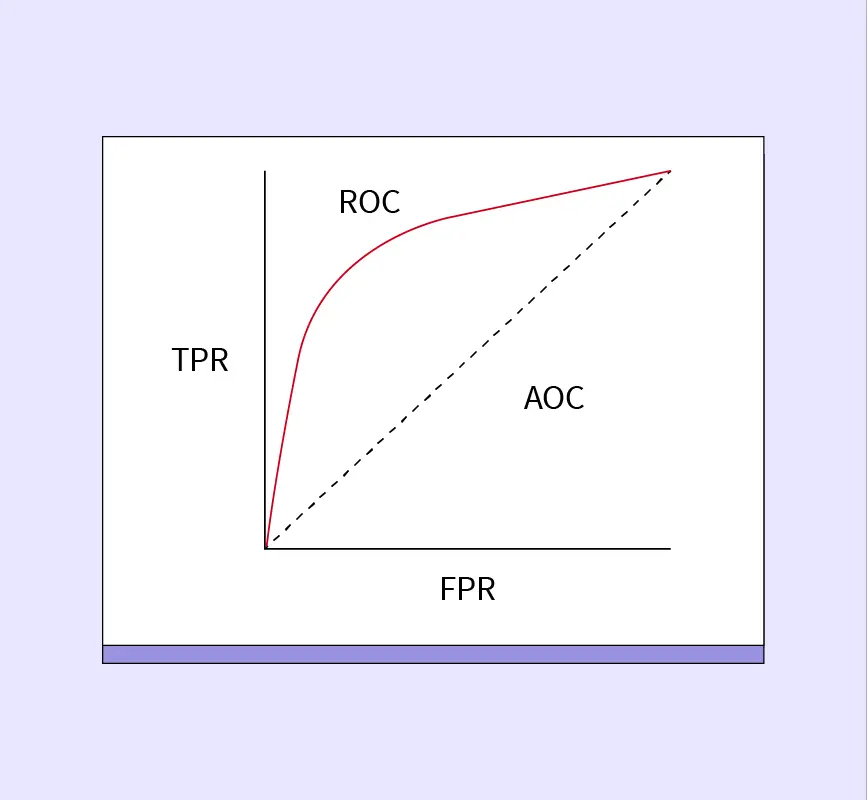
Maximum Likelihood Estimation in Machine Learning

Maximum Likelihood Estimation (MLE) is a statistical technique used to estimate the parameters of a probability distribution by maximizing the likelihood function. It is widely applied in machine learning, statistics, and AI to optimize models for tasks such as classification, regression, and generative modeling. MLE is commonly used in logistic regression, Gaussian Mixture Models (GMMs), ...

standardization in machine learning

What is Standardization in Machine Learning?

Standardization in machine learning is a preprocessing technique used to transform numerical features so that they have a mean of zero and a standard deviation of one. This ensures that all features contribute equally to the model, preventing bias caused by different scales of measurement. Standardization is crucial for improving model performance, especially in algorithms ...

dempster shafer theory in artificial intelligence

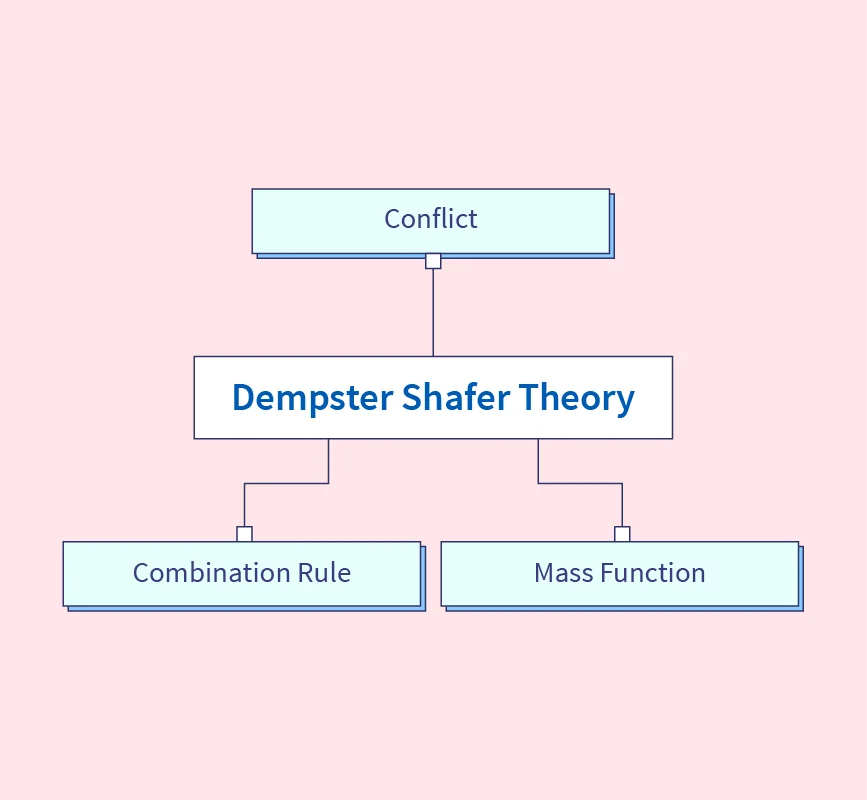
Dempster Shafer Theory in Artificial Intelligence

The Dempster-Shafer Theory (DST) is a mathematical framework for handling uncertainty and incomplete information in decision-making. Unlike traditional probability theory, which requires prior probabilities, DST allows for degrees of belief based on available evidence. This makes it highly useful in artificial intelligence, expert systems, and data fusion applications. What is Dempster Shafer Theory? The Dempster-Shafer ...

Anshuman Singh

data visualization tools

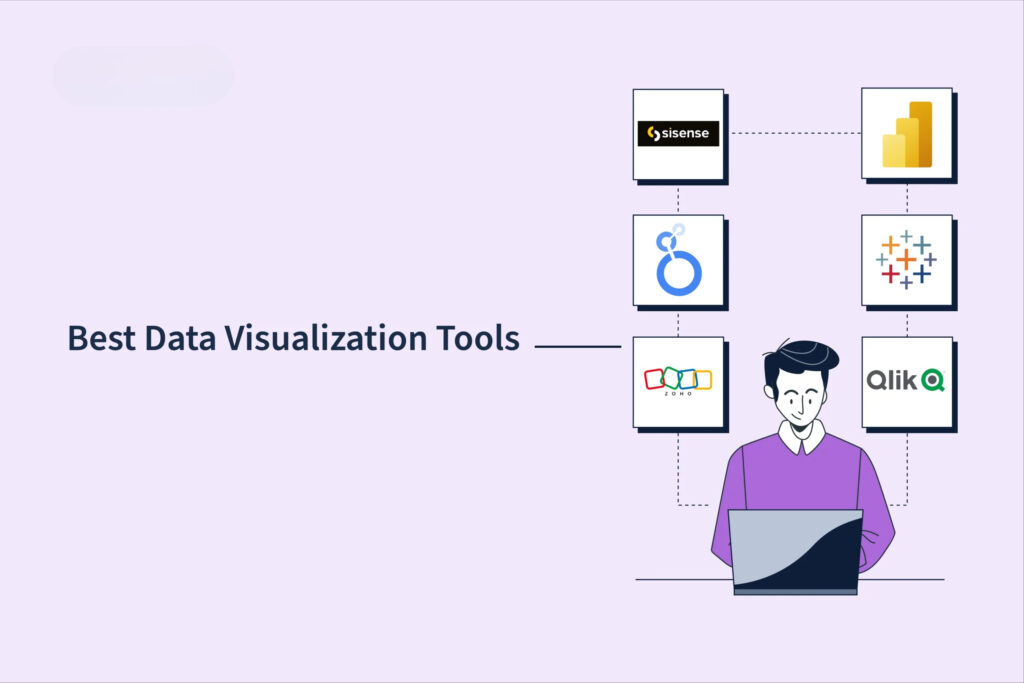
25 Best Data Visualization Tools for 2025

Data visualization tools are software solutions designed to help users convert raw data into graphical representations such as charts, graphs, heatmaps, and dashboards. These tools simplify data analysis, making complex datasets more comprehensible, interactive, and actionable. Businesses, researchers, and analysts use data visualization tools to identify trends, track performance, and make data-driven decisions. The importance ...

Anshuman Singh

data visualization

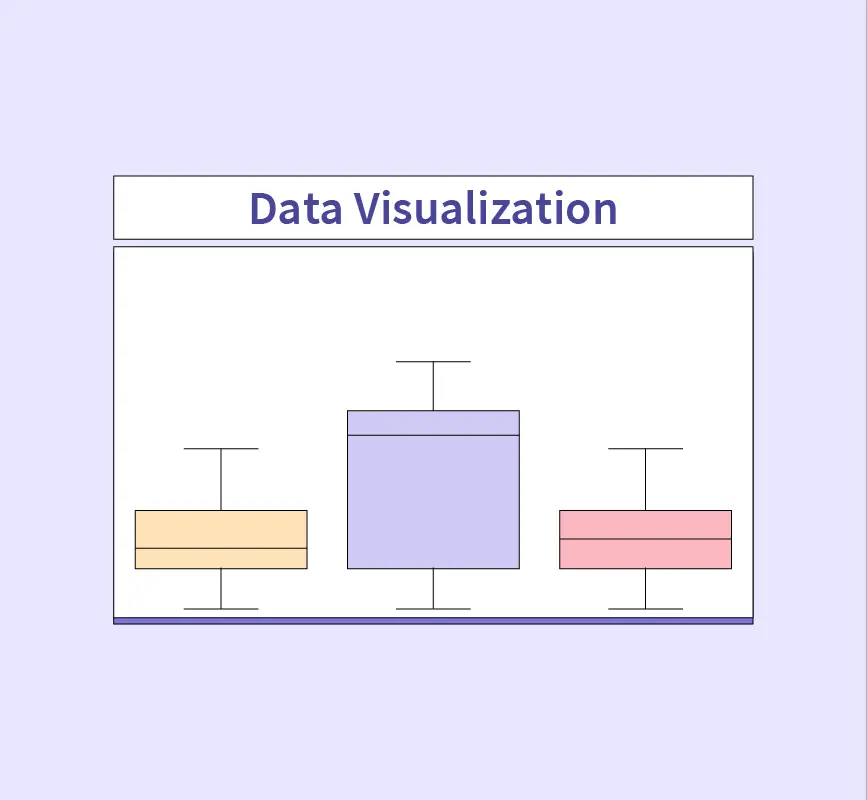
What is Data Visualization? Definition, Importance, & Types

Data visualization is the process of representing data through graphs, charts, maps, and interactive dashboards to simplify complex information. It enables users to identify patterns, trends, and insights that may not be immediately apparent in raw datasets. In the era of big data and AI-driven analytics, data visualization plays a crucial role in decision-making by ...

ai automation

What is AI Automation? A Complete Guide

AI automation refers to the integration of artificial intelligence (AI) and automation technologies to create intelligent, self-learning systems that enhance business operations, decision-making, and efficiency. AI automation enables machines to analyze data, learn from patterns, and execute tasks with minimal human intervention. The relationship between AI and automation is crucial to understanding their combined impact. ...