Data Visualization using Matplotlib
Data Visualization is an important part of business activities as organizations nowadays collect a huge amount of data. Sensors all over the world are collecting climate data, user data through clicks, car data for prediction of steering wheels etc. All of these data collected hold key insights for businesses and visualizations make these insights easy to interpret.
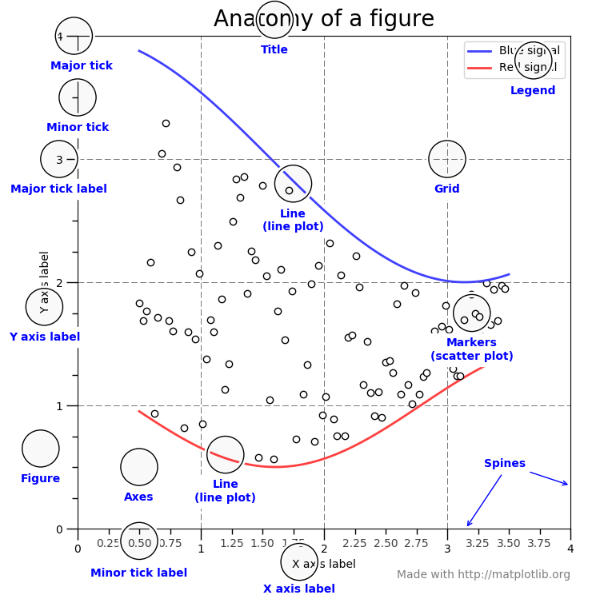
Data visualizations in python can be done via many packages. We’ll be discussing of Matplotlib package. It can be used in Python scripts, Jupyter notebook, and web application servers.